

Visual Storytelling Through Infographics
Turn complex ideas into clear, compelling, on-brand visuals. At Universe, we design infographics for nonprofits, research institutes, academic organizations, and public-facing teams. Whether you’re sharing research, impact, data, or policy insights, a well-designed infographic makes your message easier to understand and more engaging.
Infographic Examples
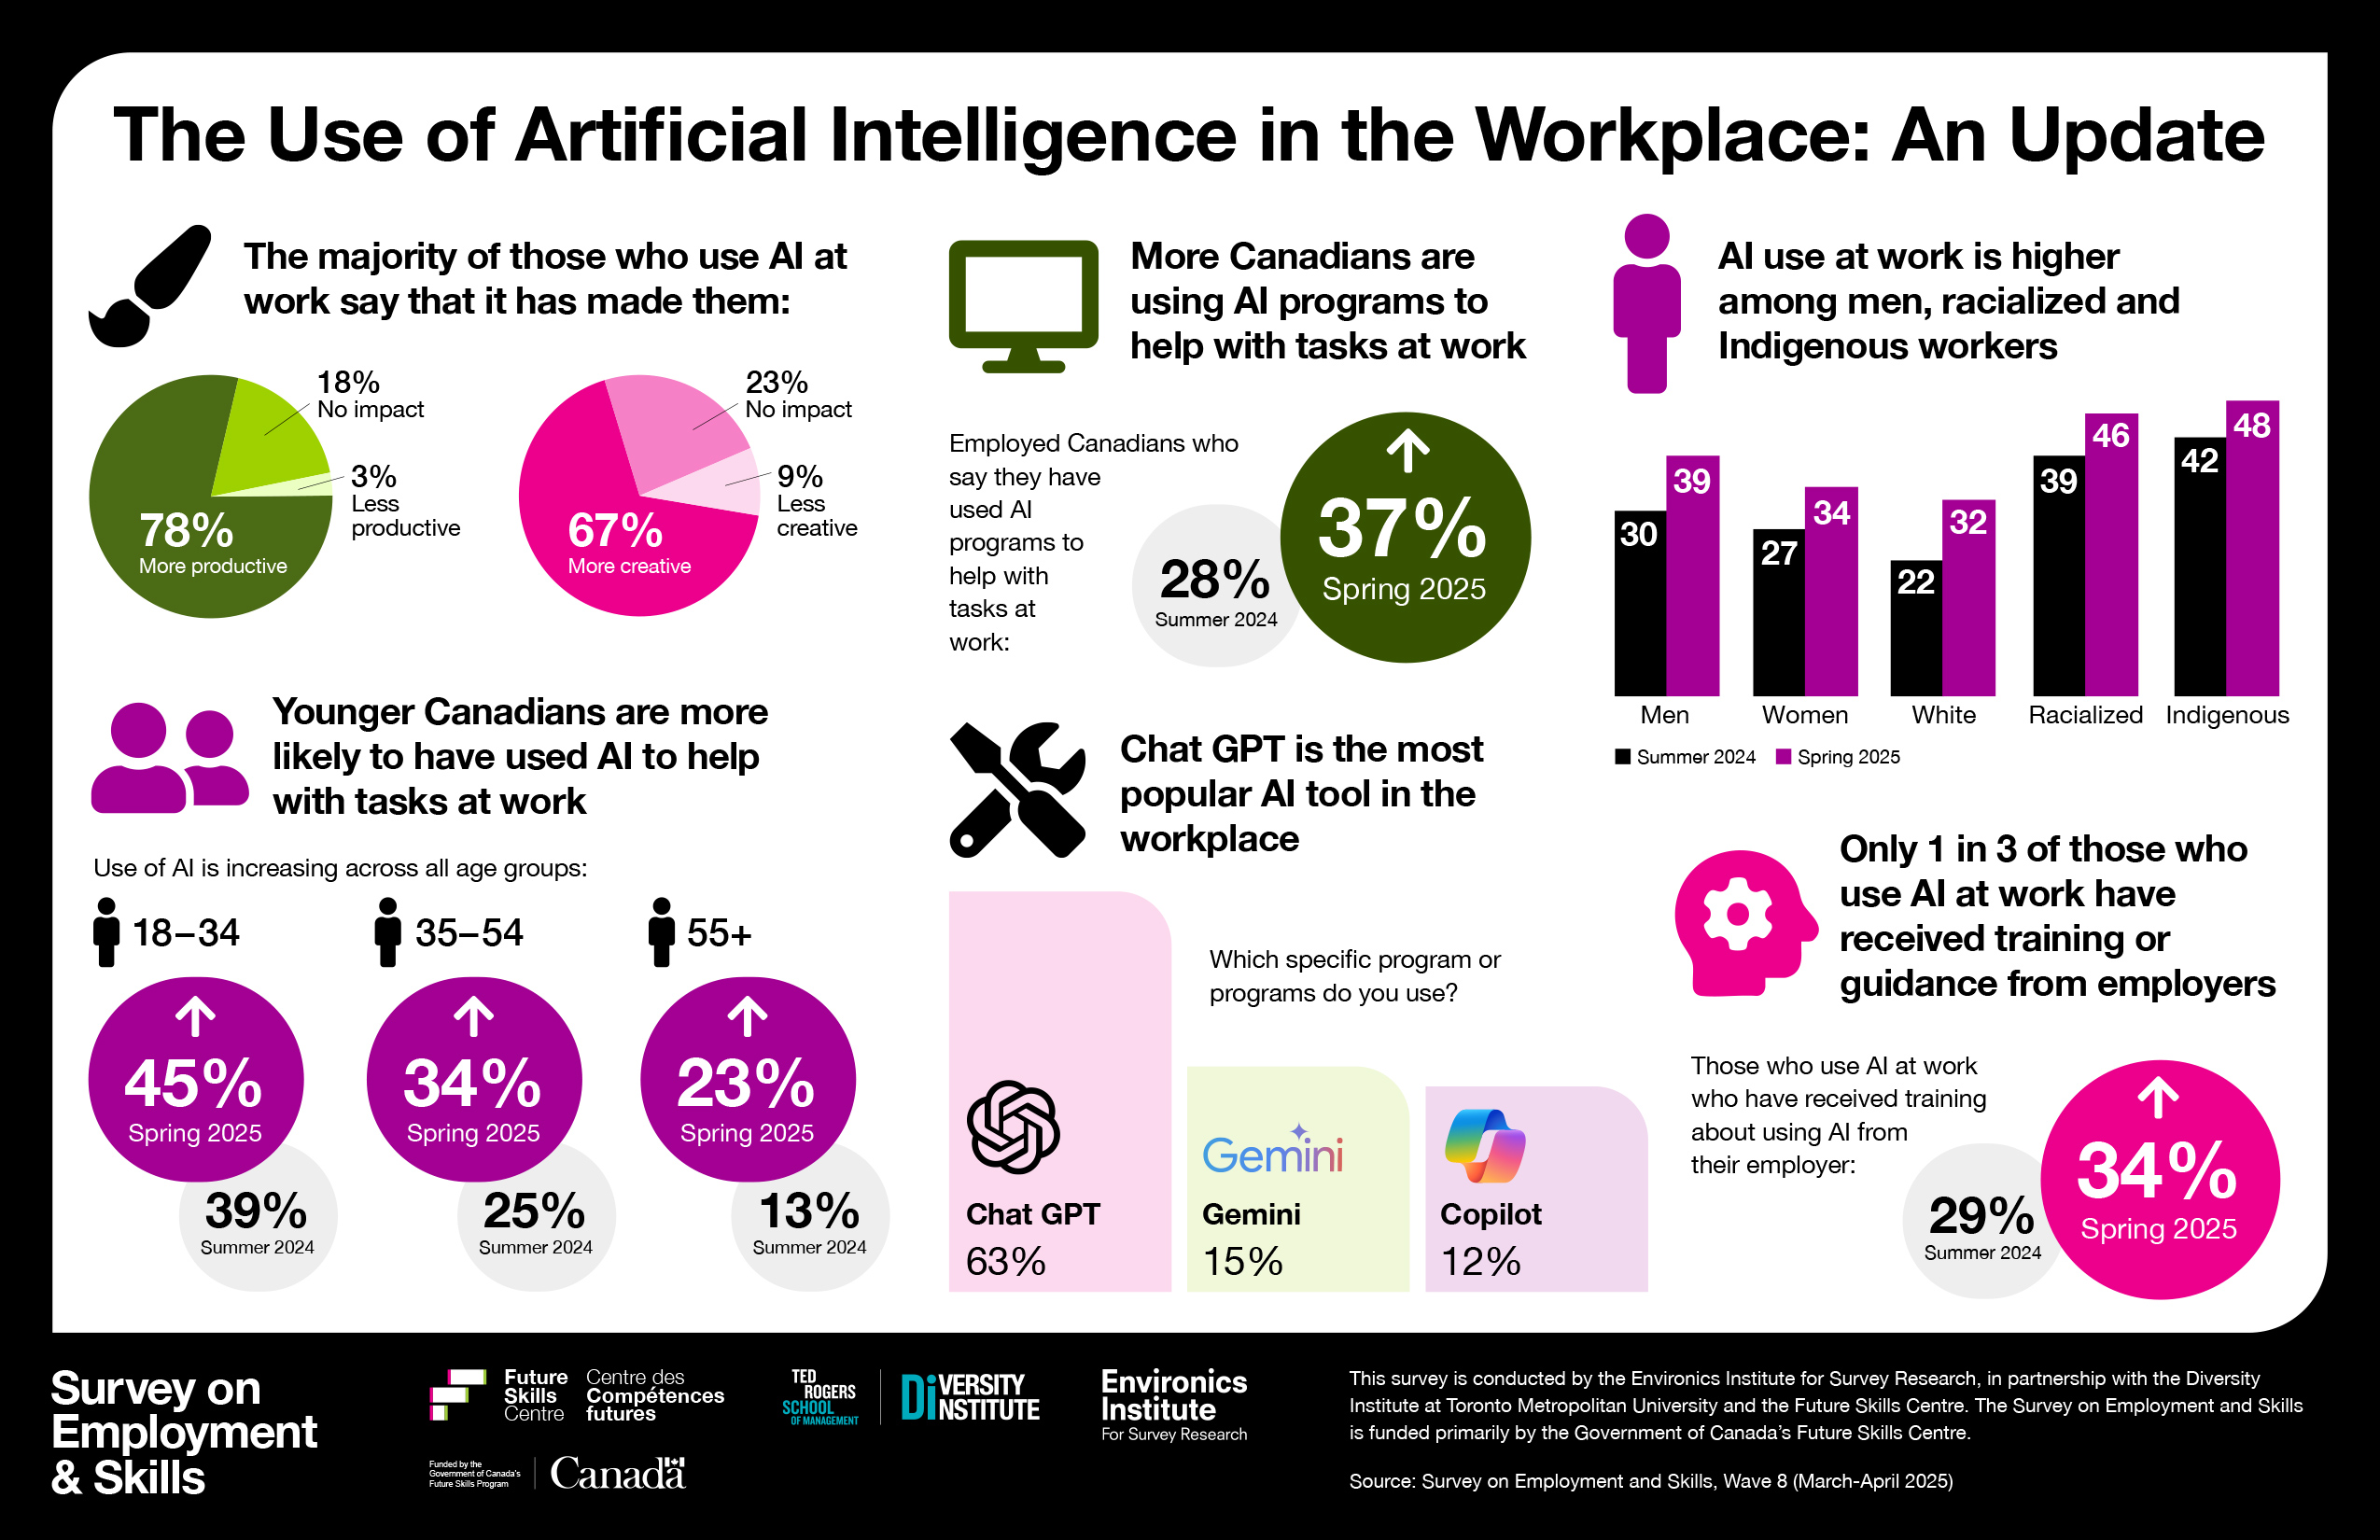
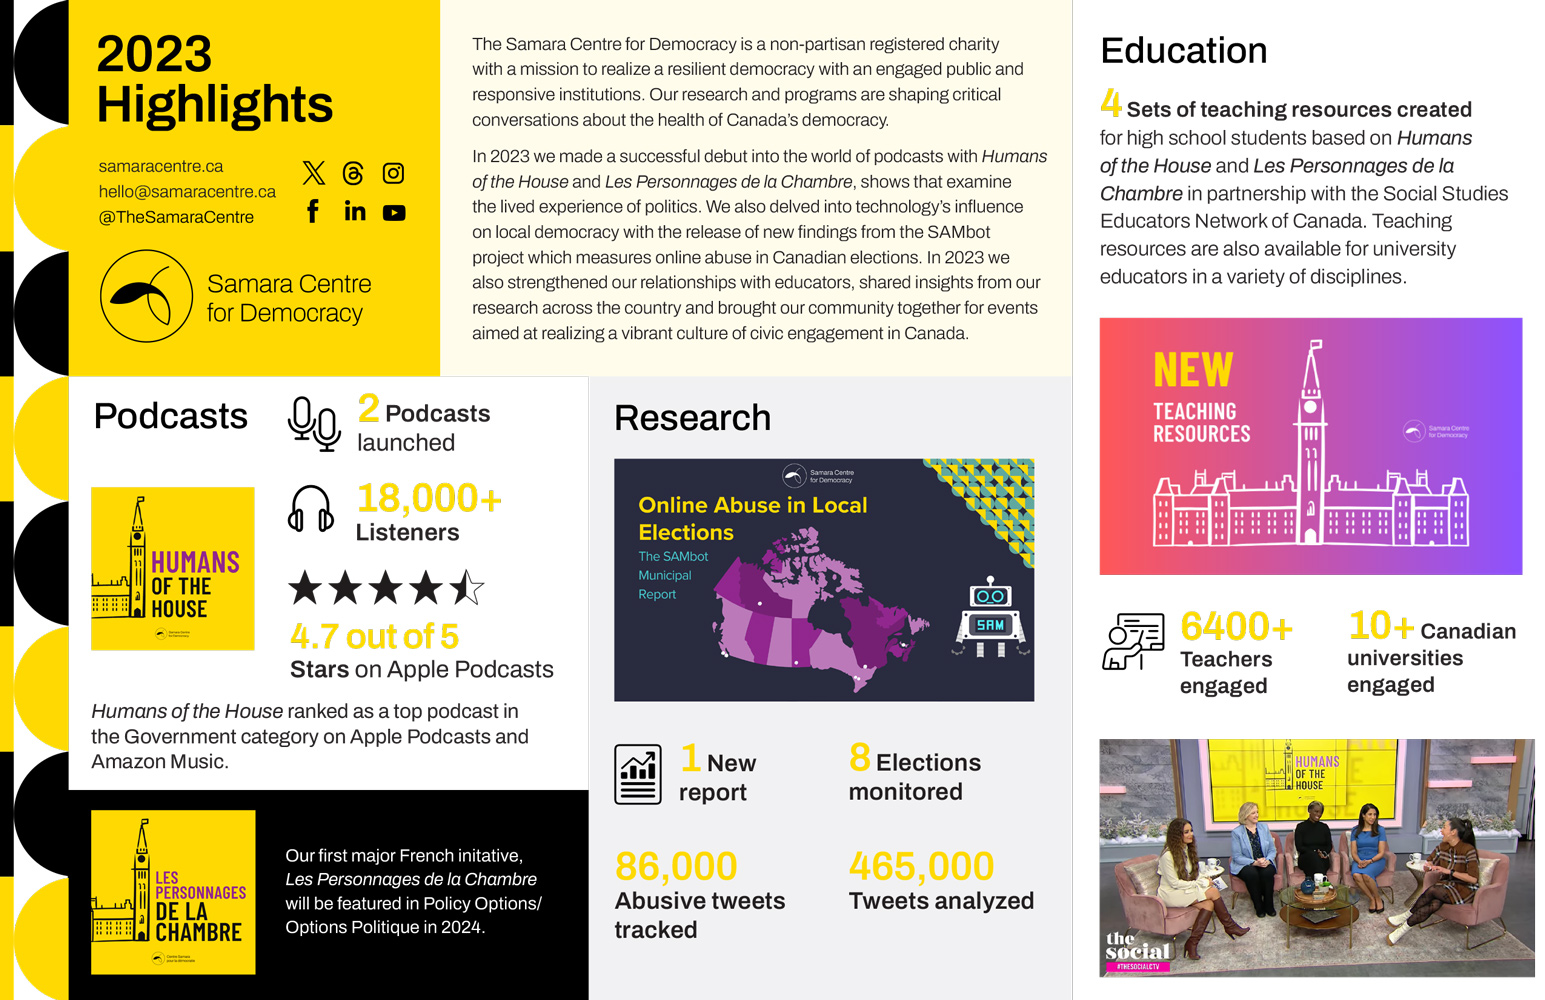
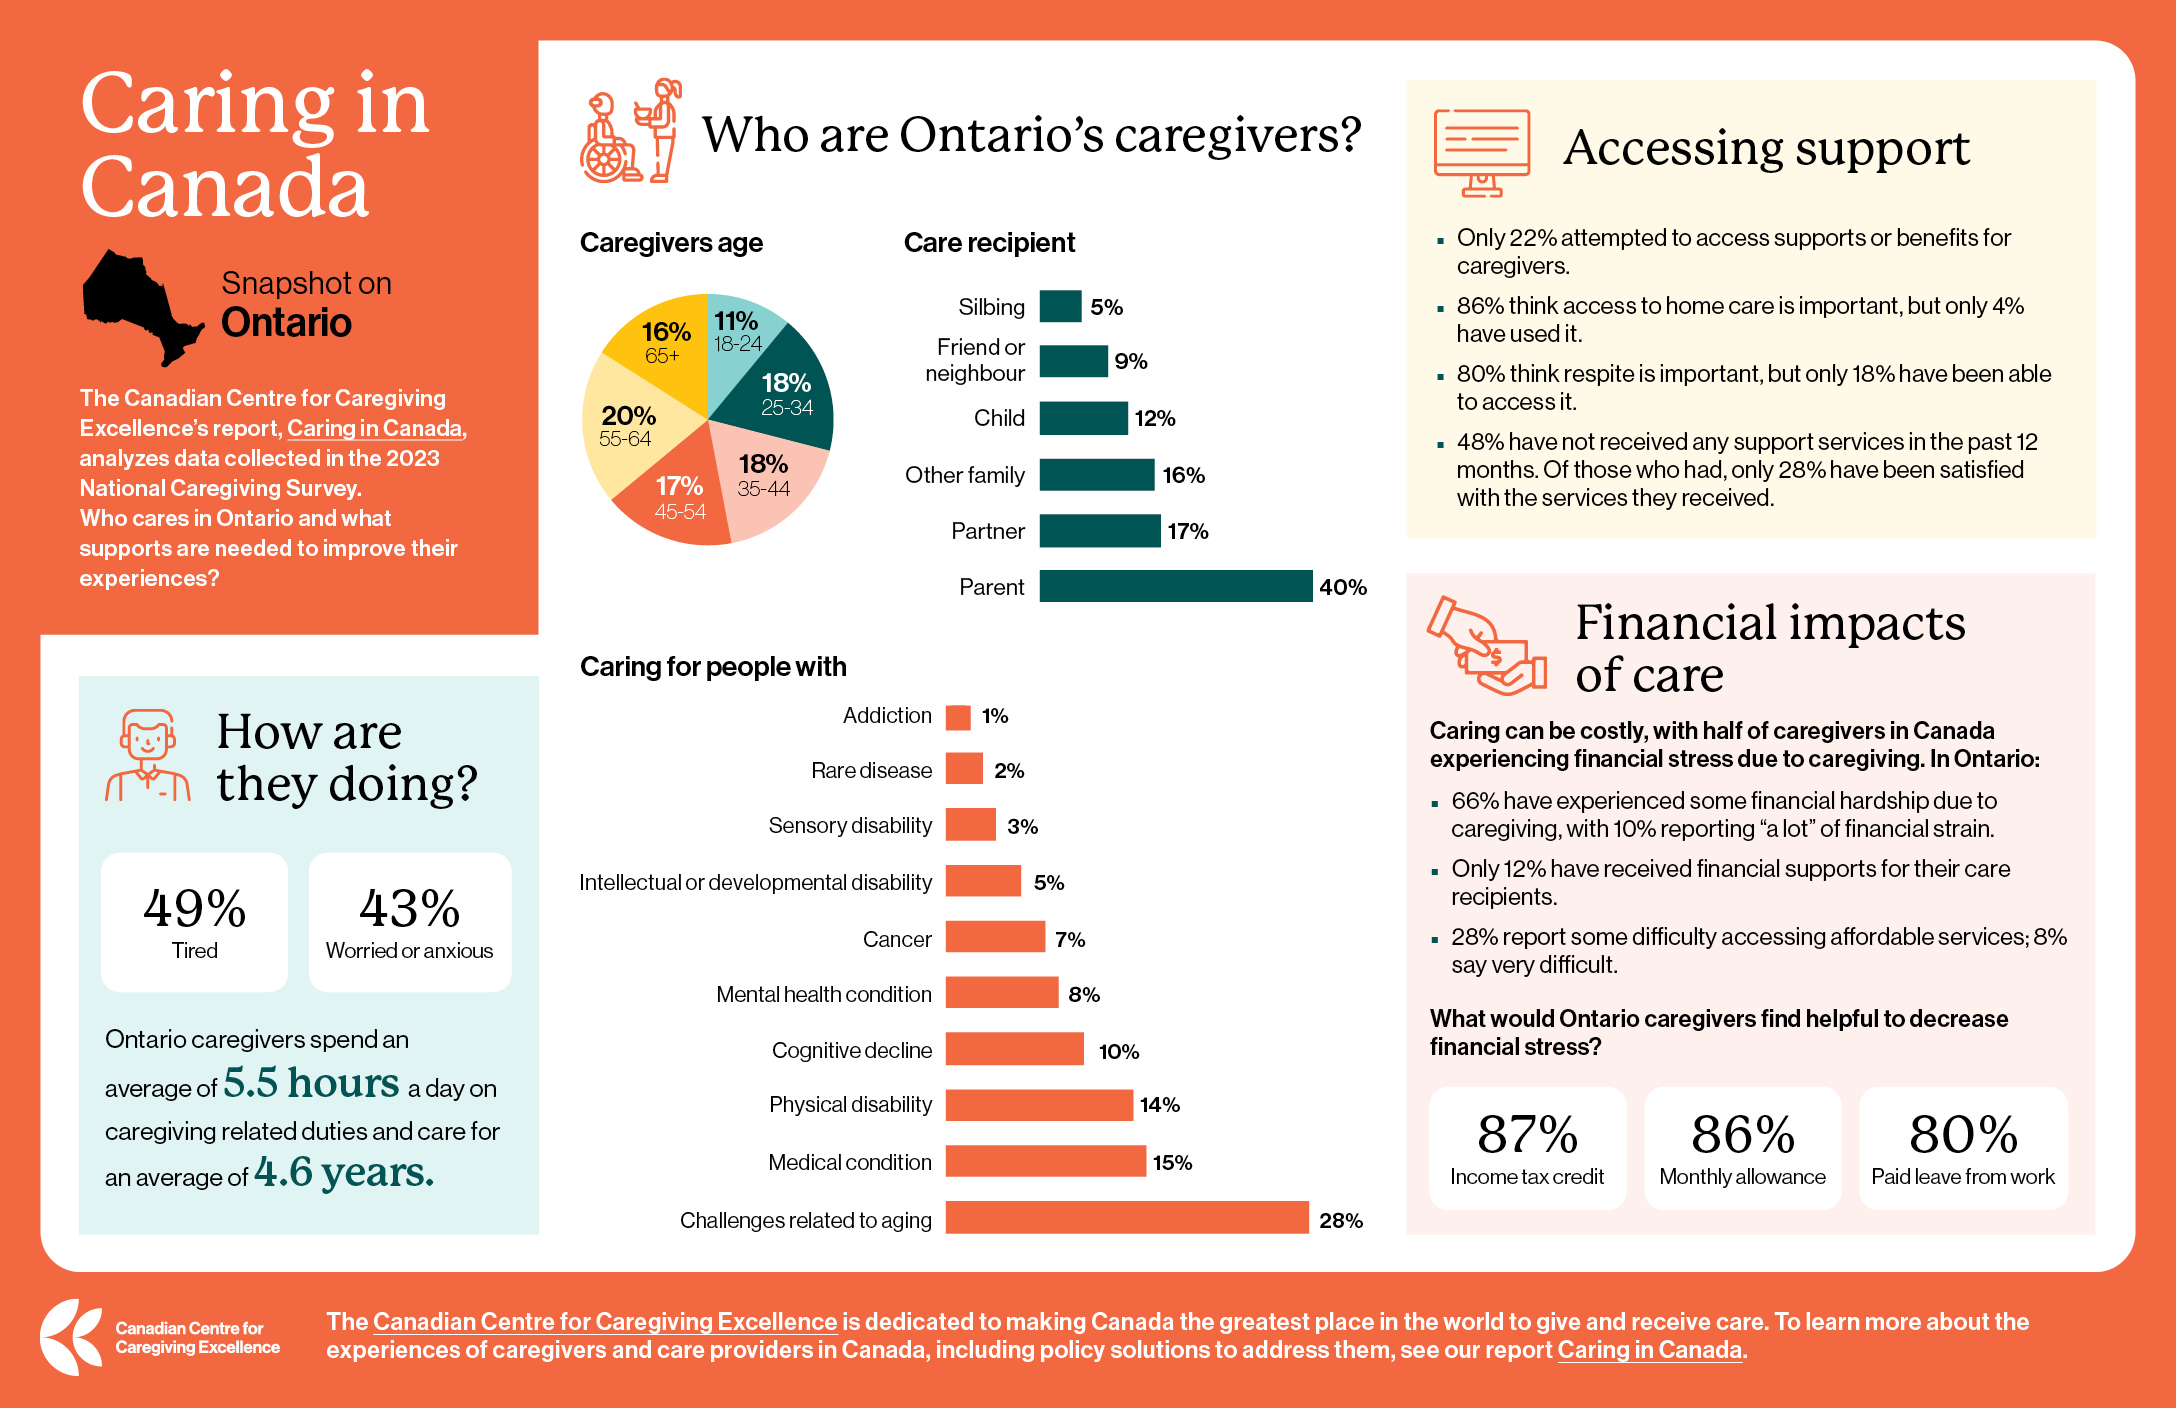
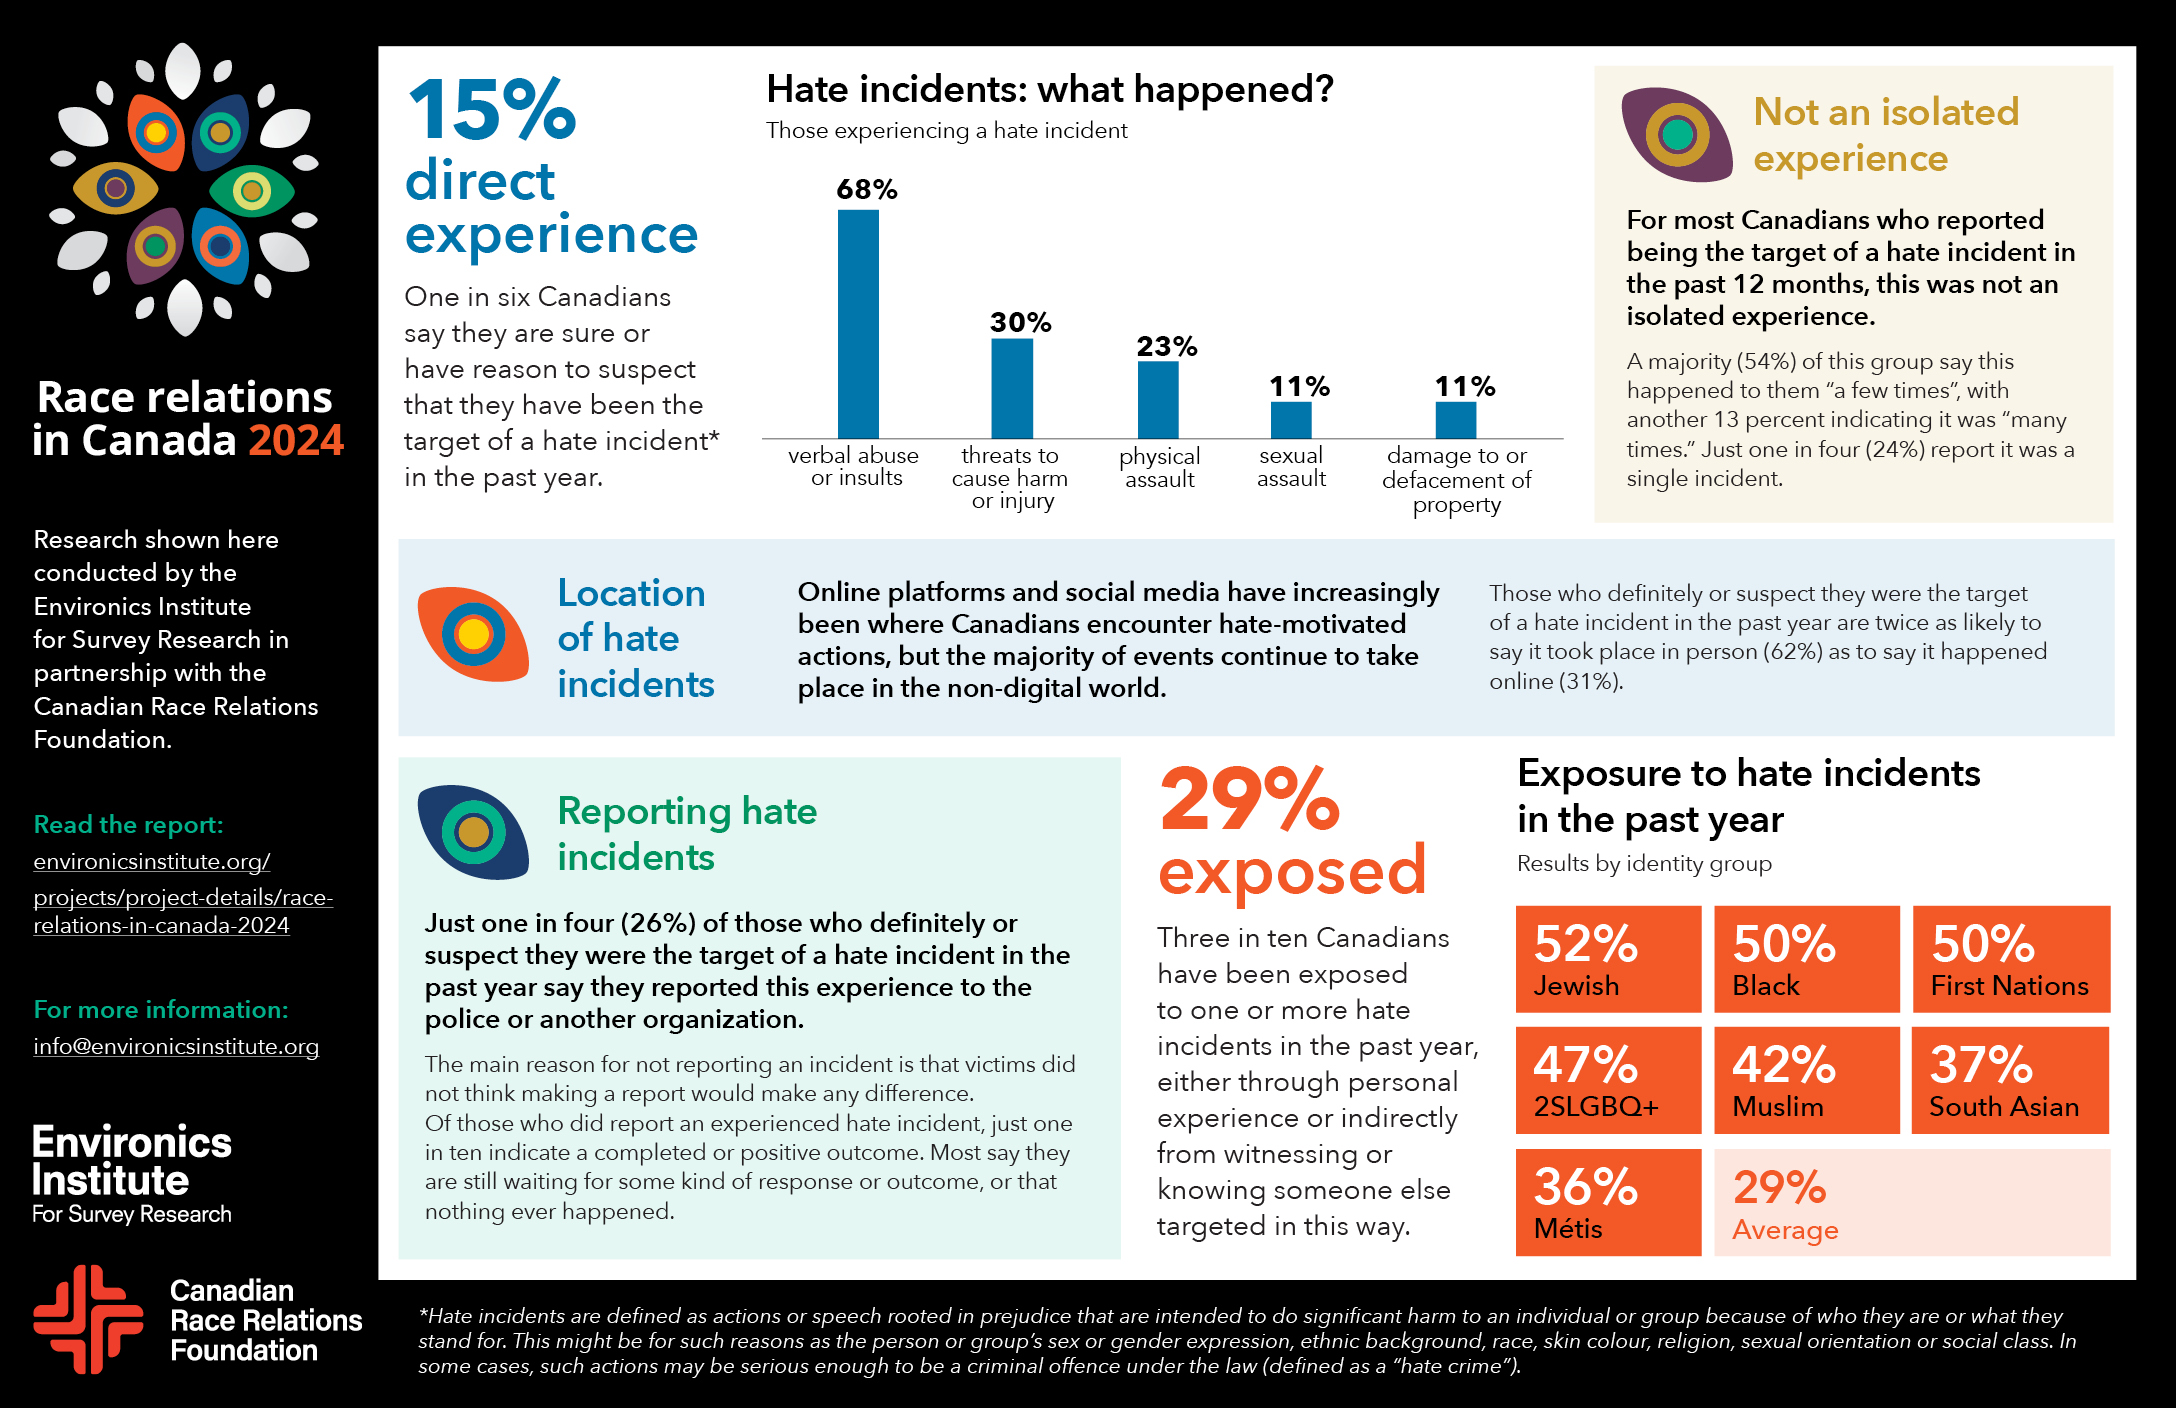
We love the 11 × 17 landscape format for infographics that contain substantial information. The larger format allows for clear viewing while making it easy to adapt individual data points or sections into social media graphics.
More Infographic Designs

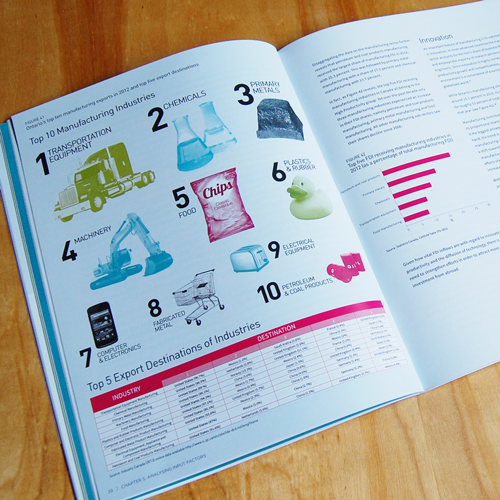
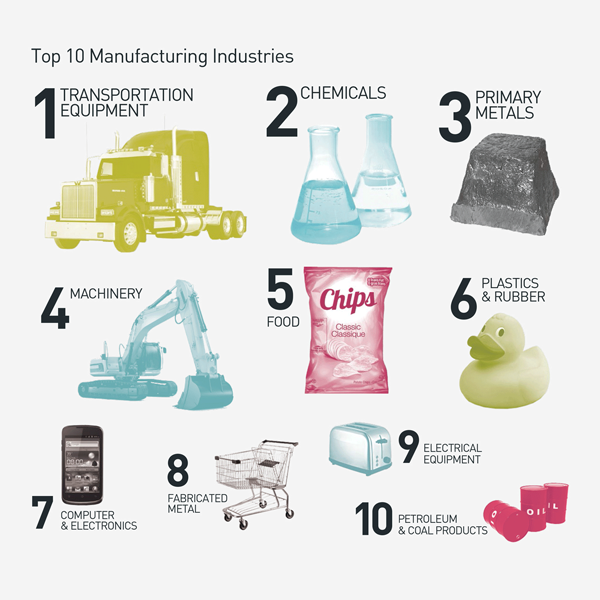
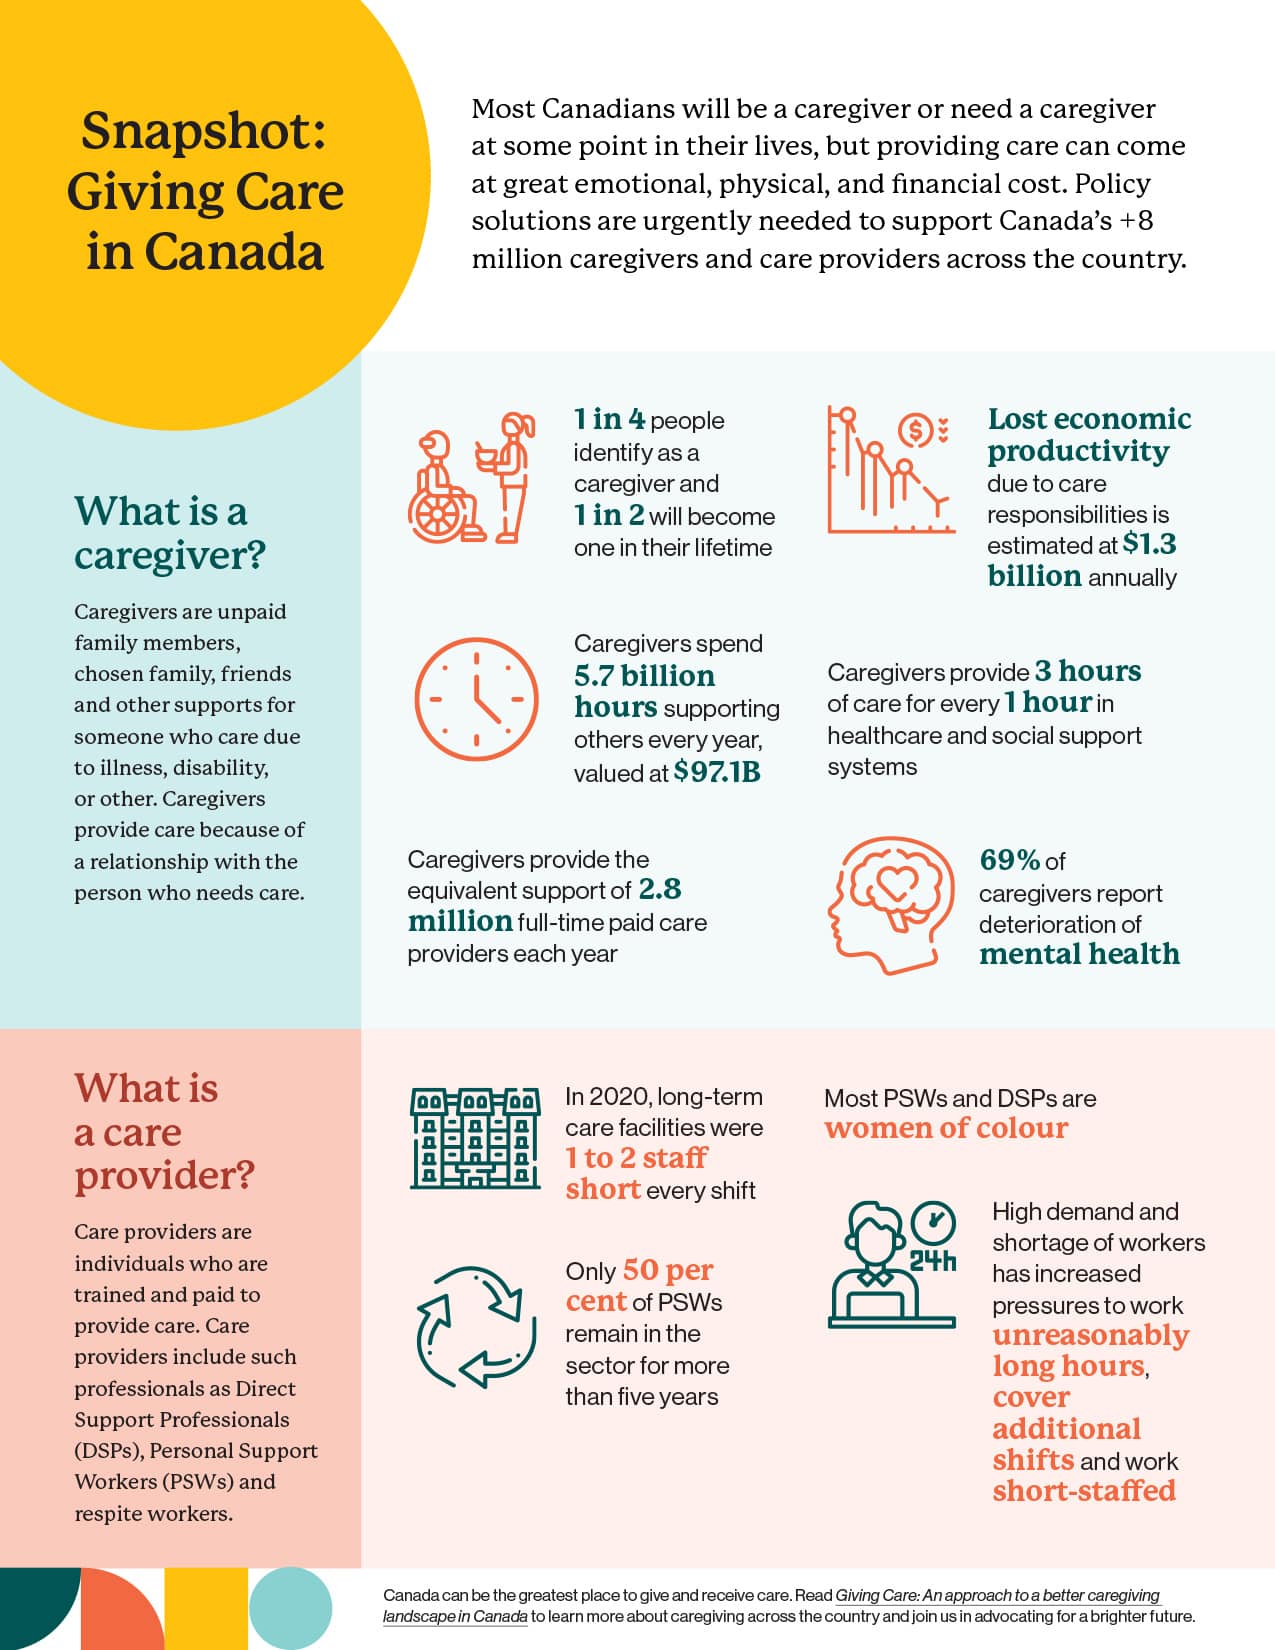
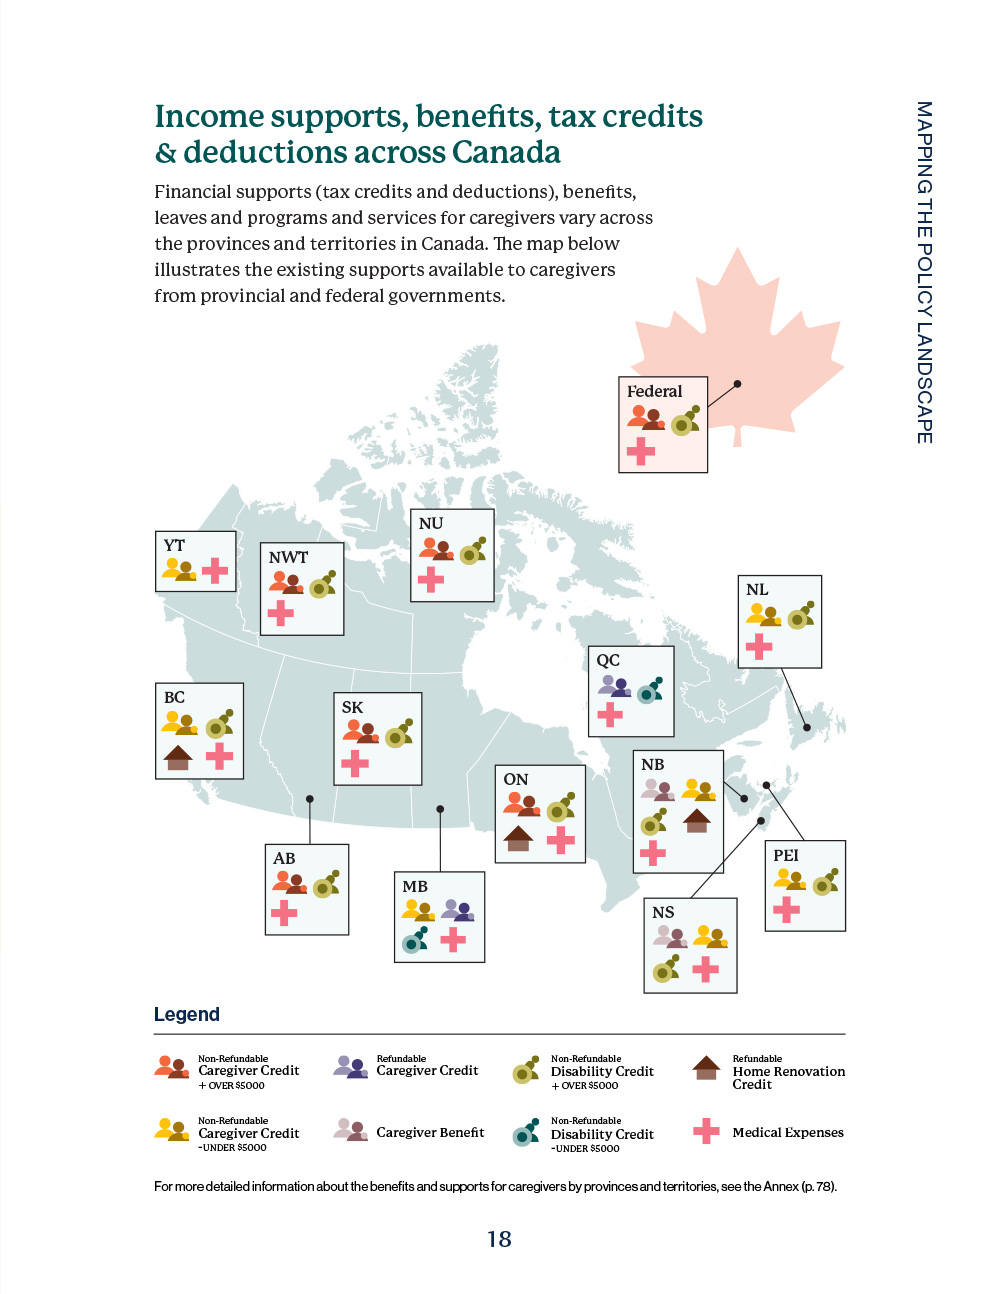
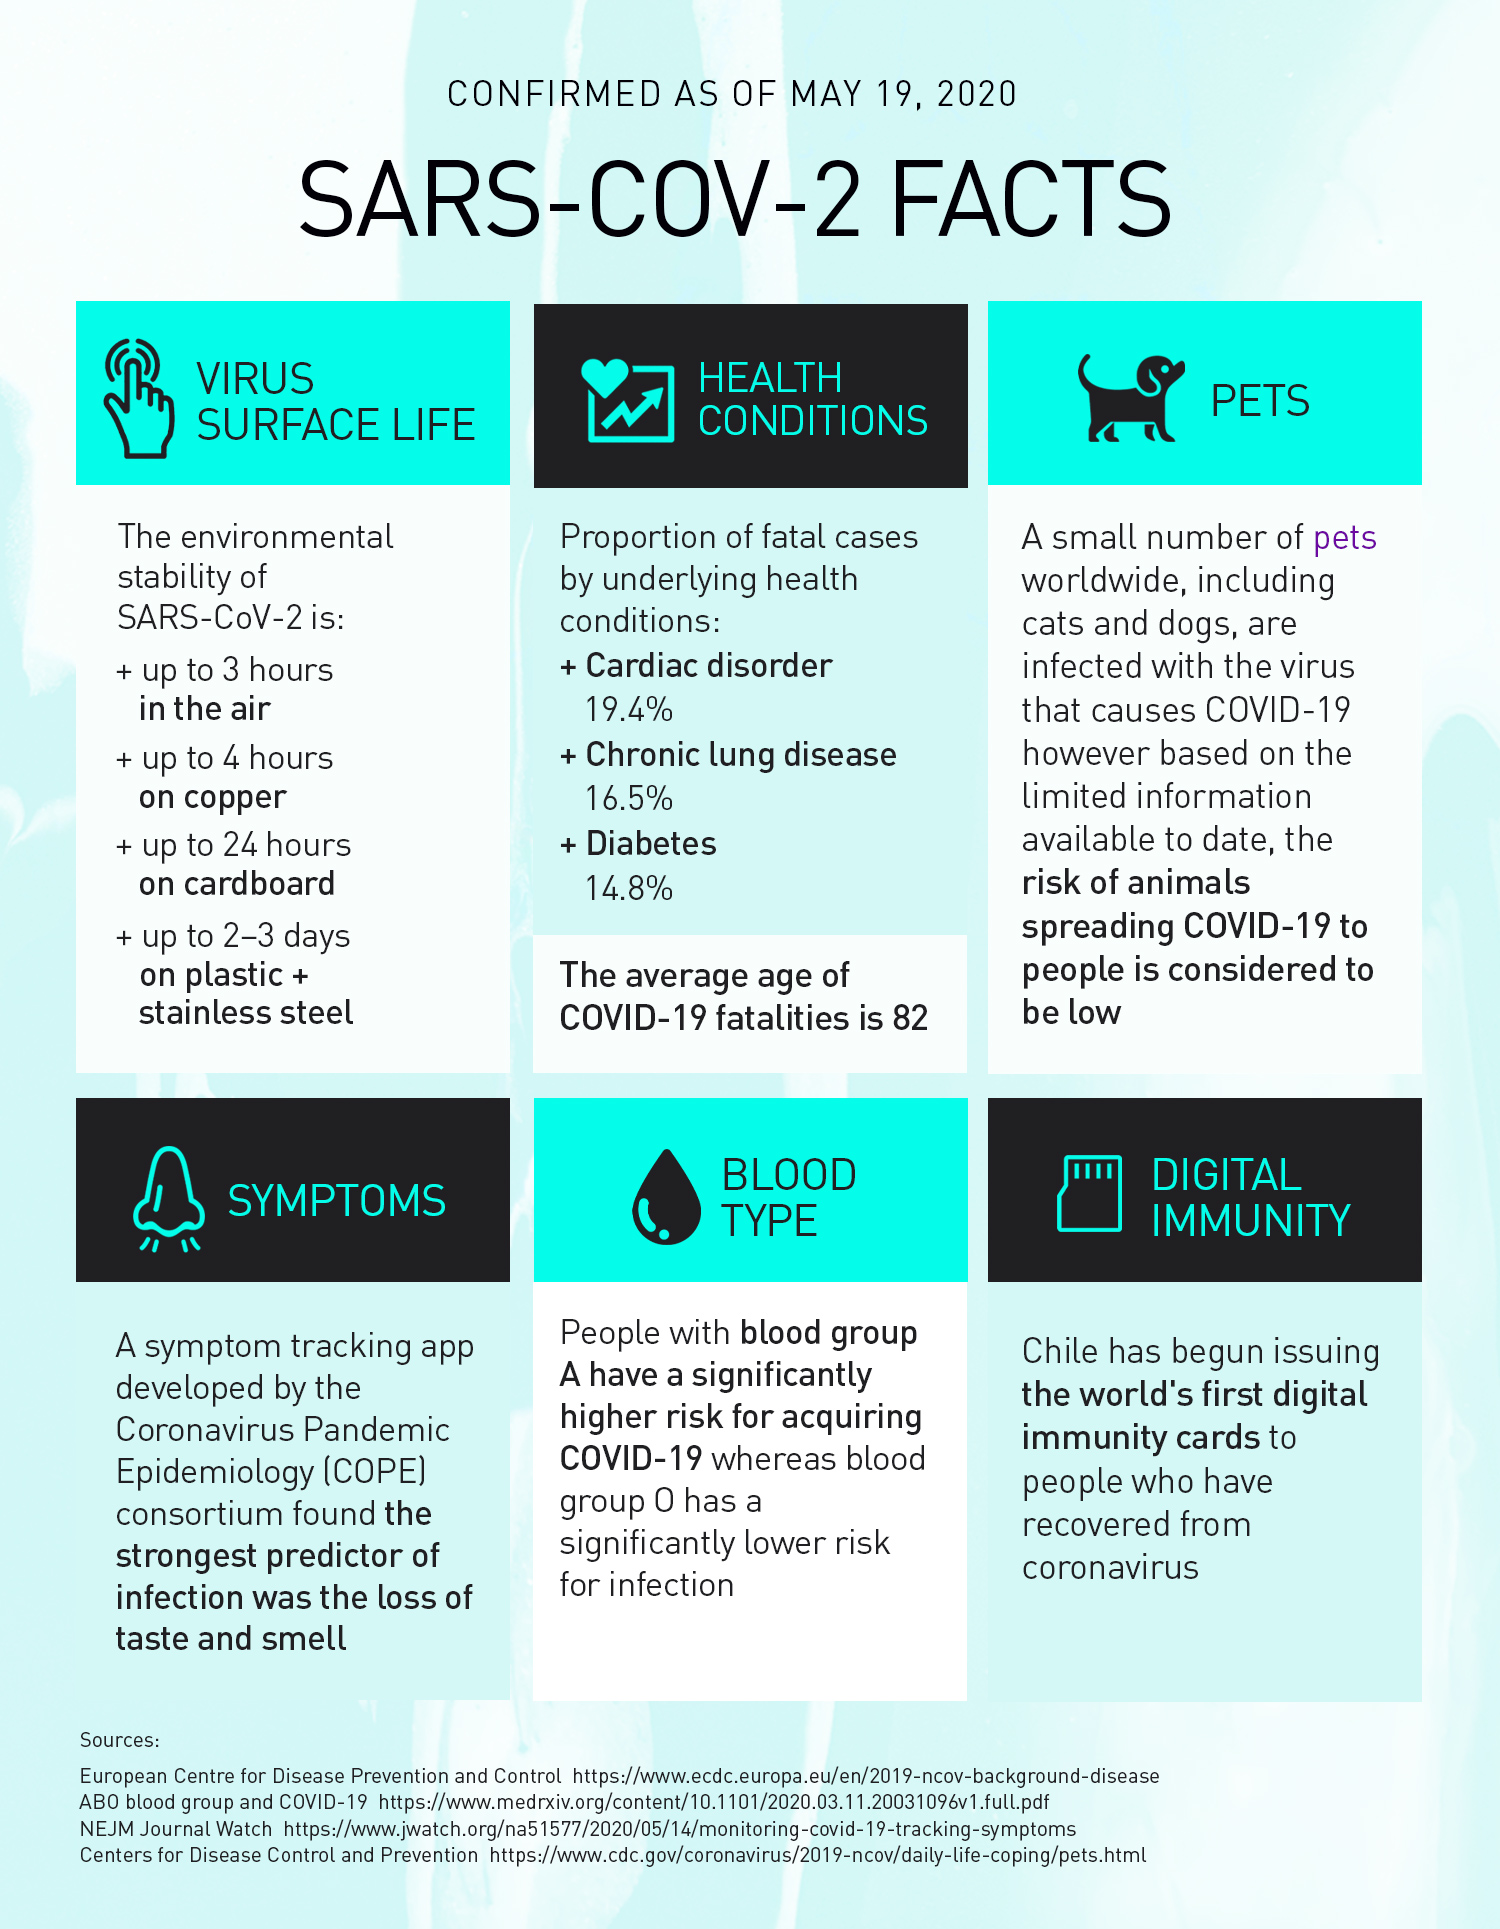
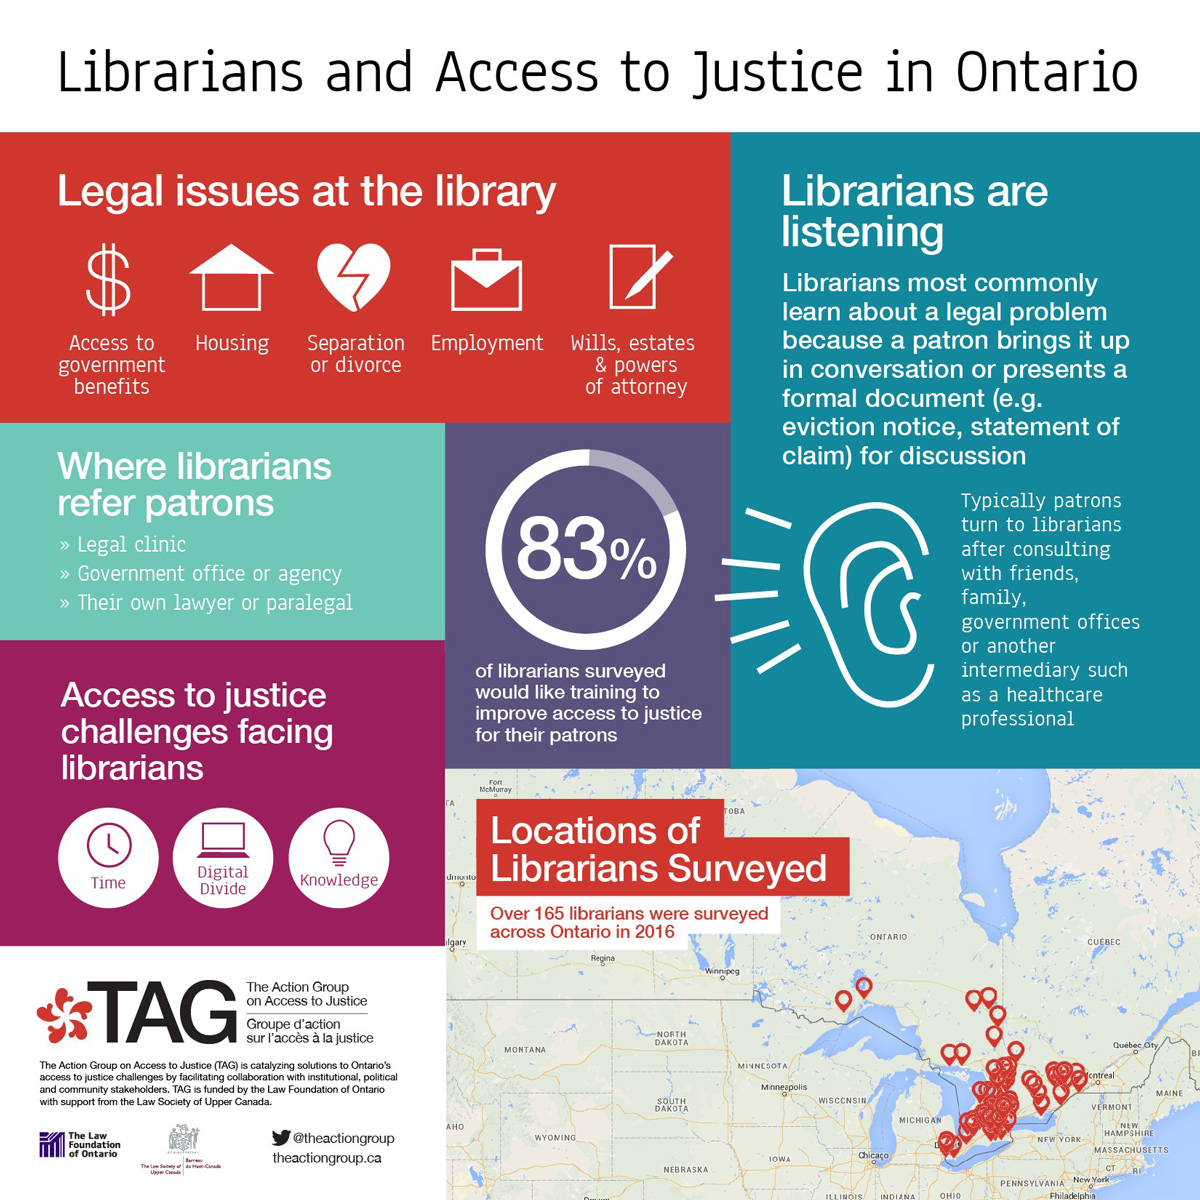
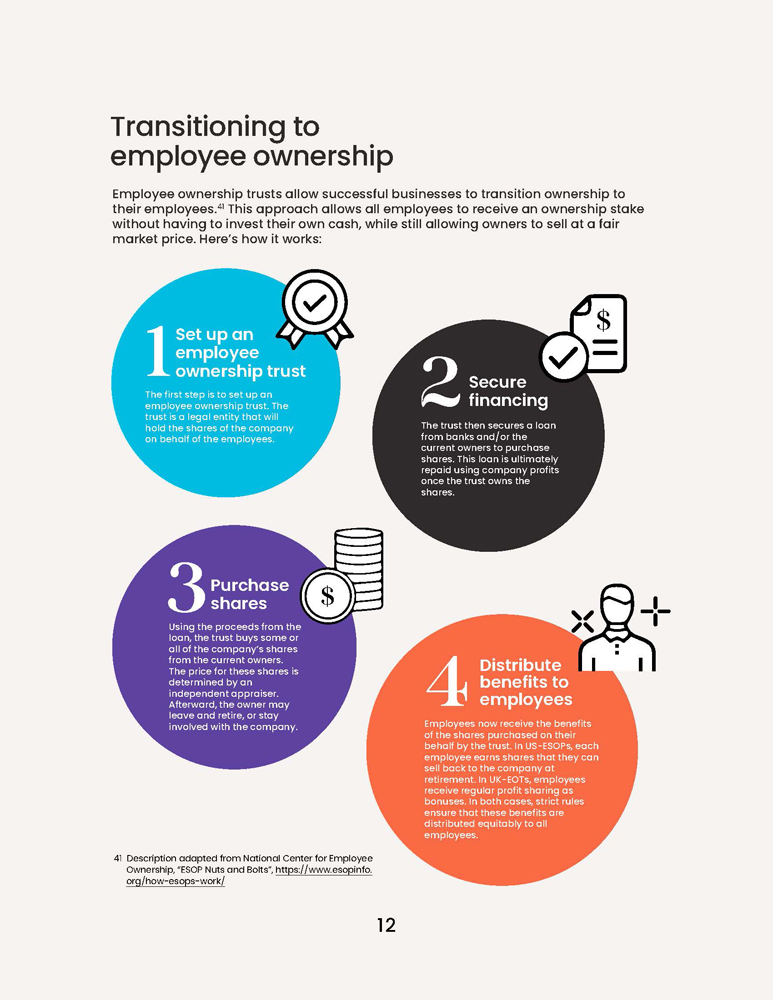
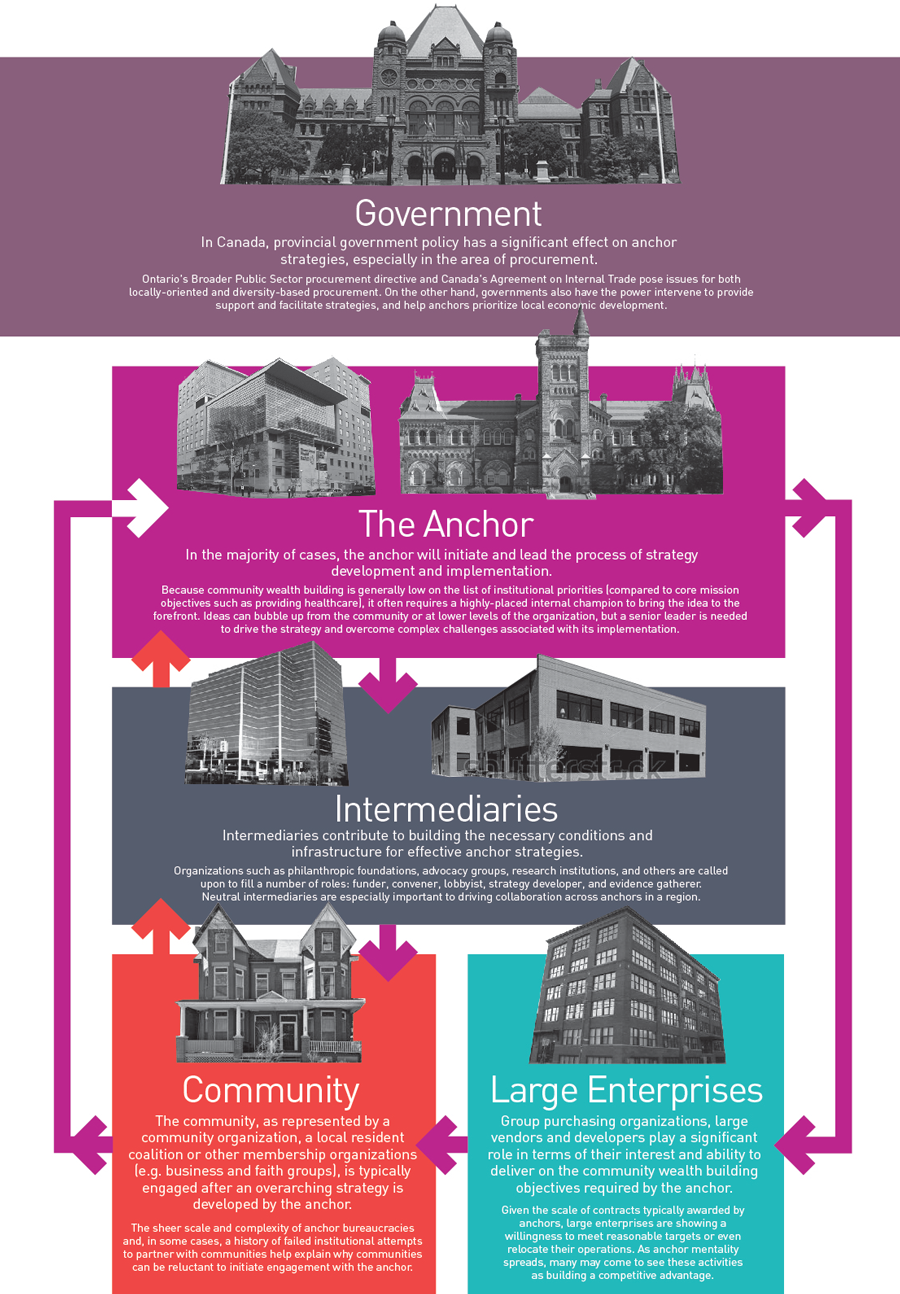
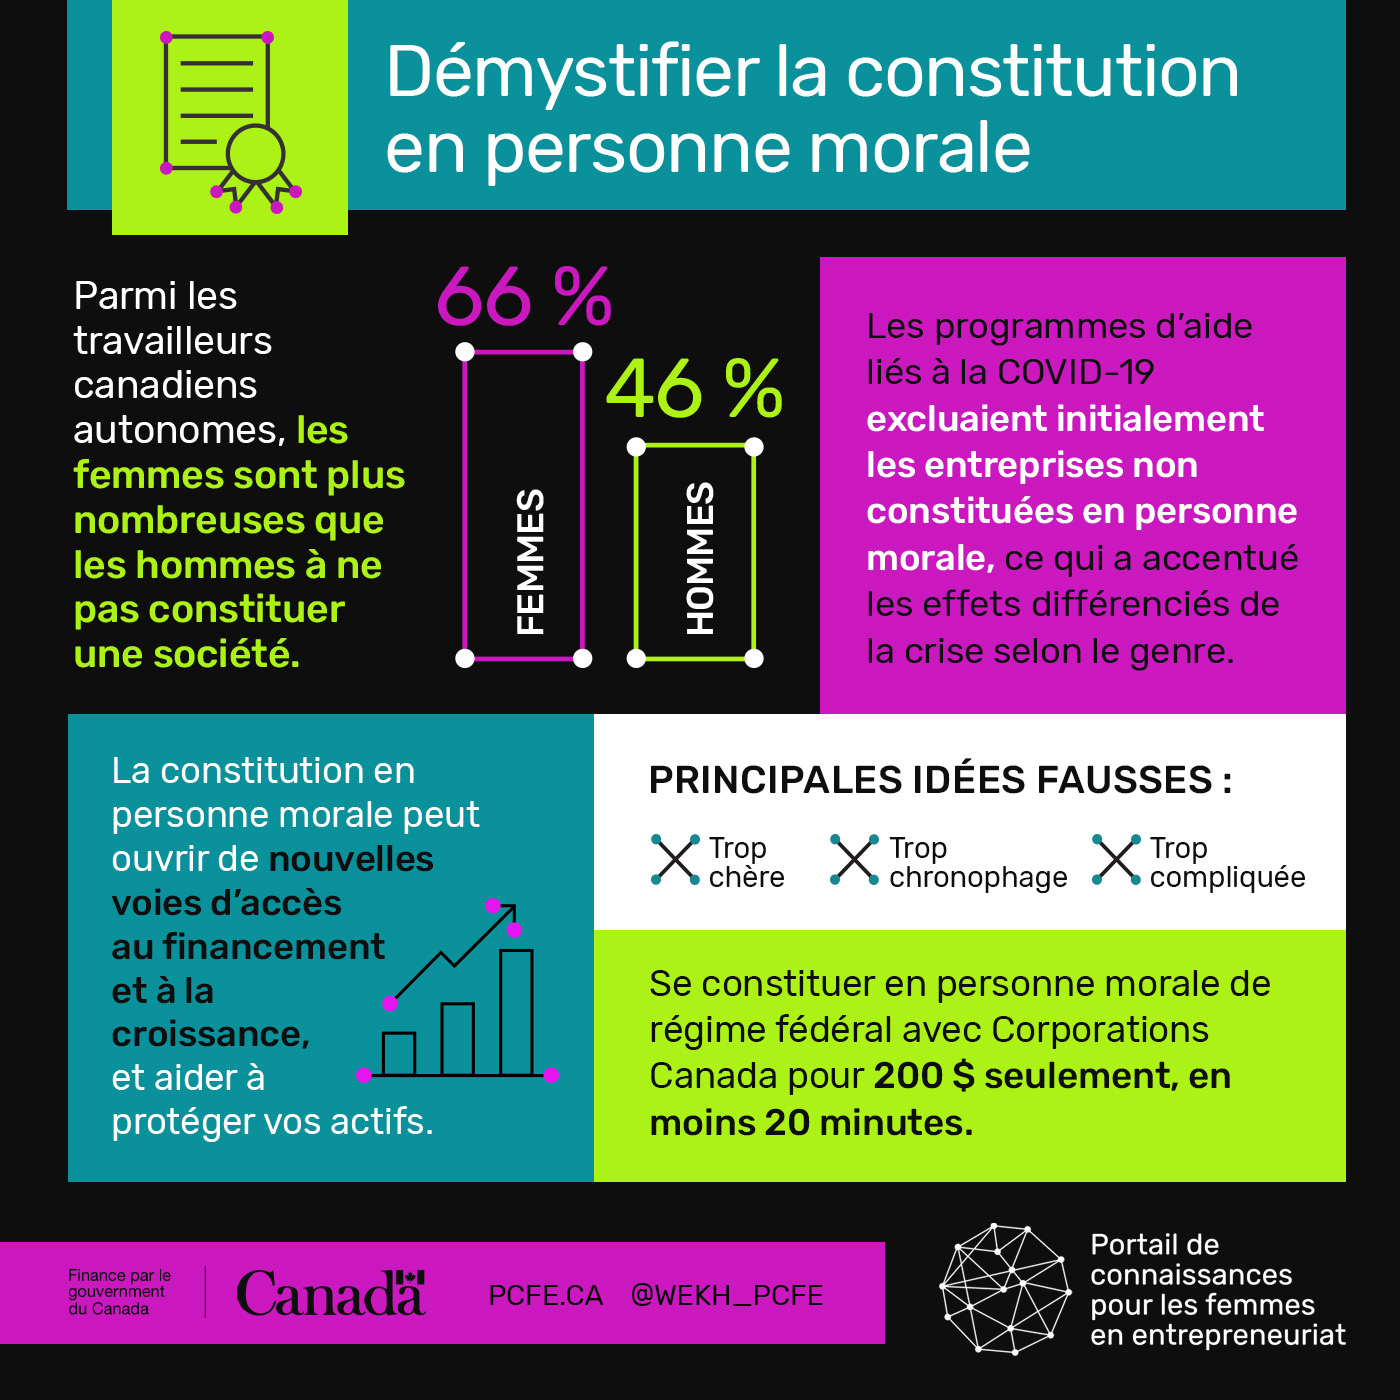
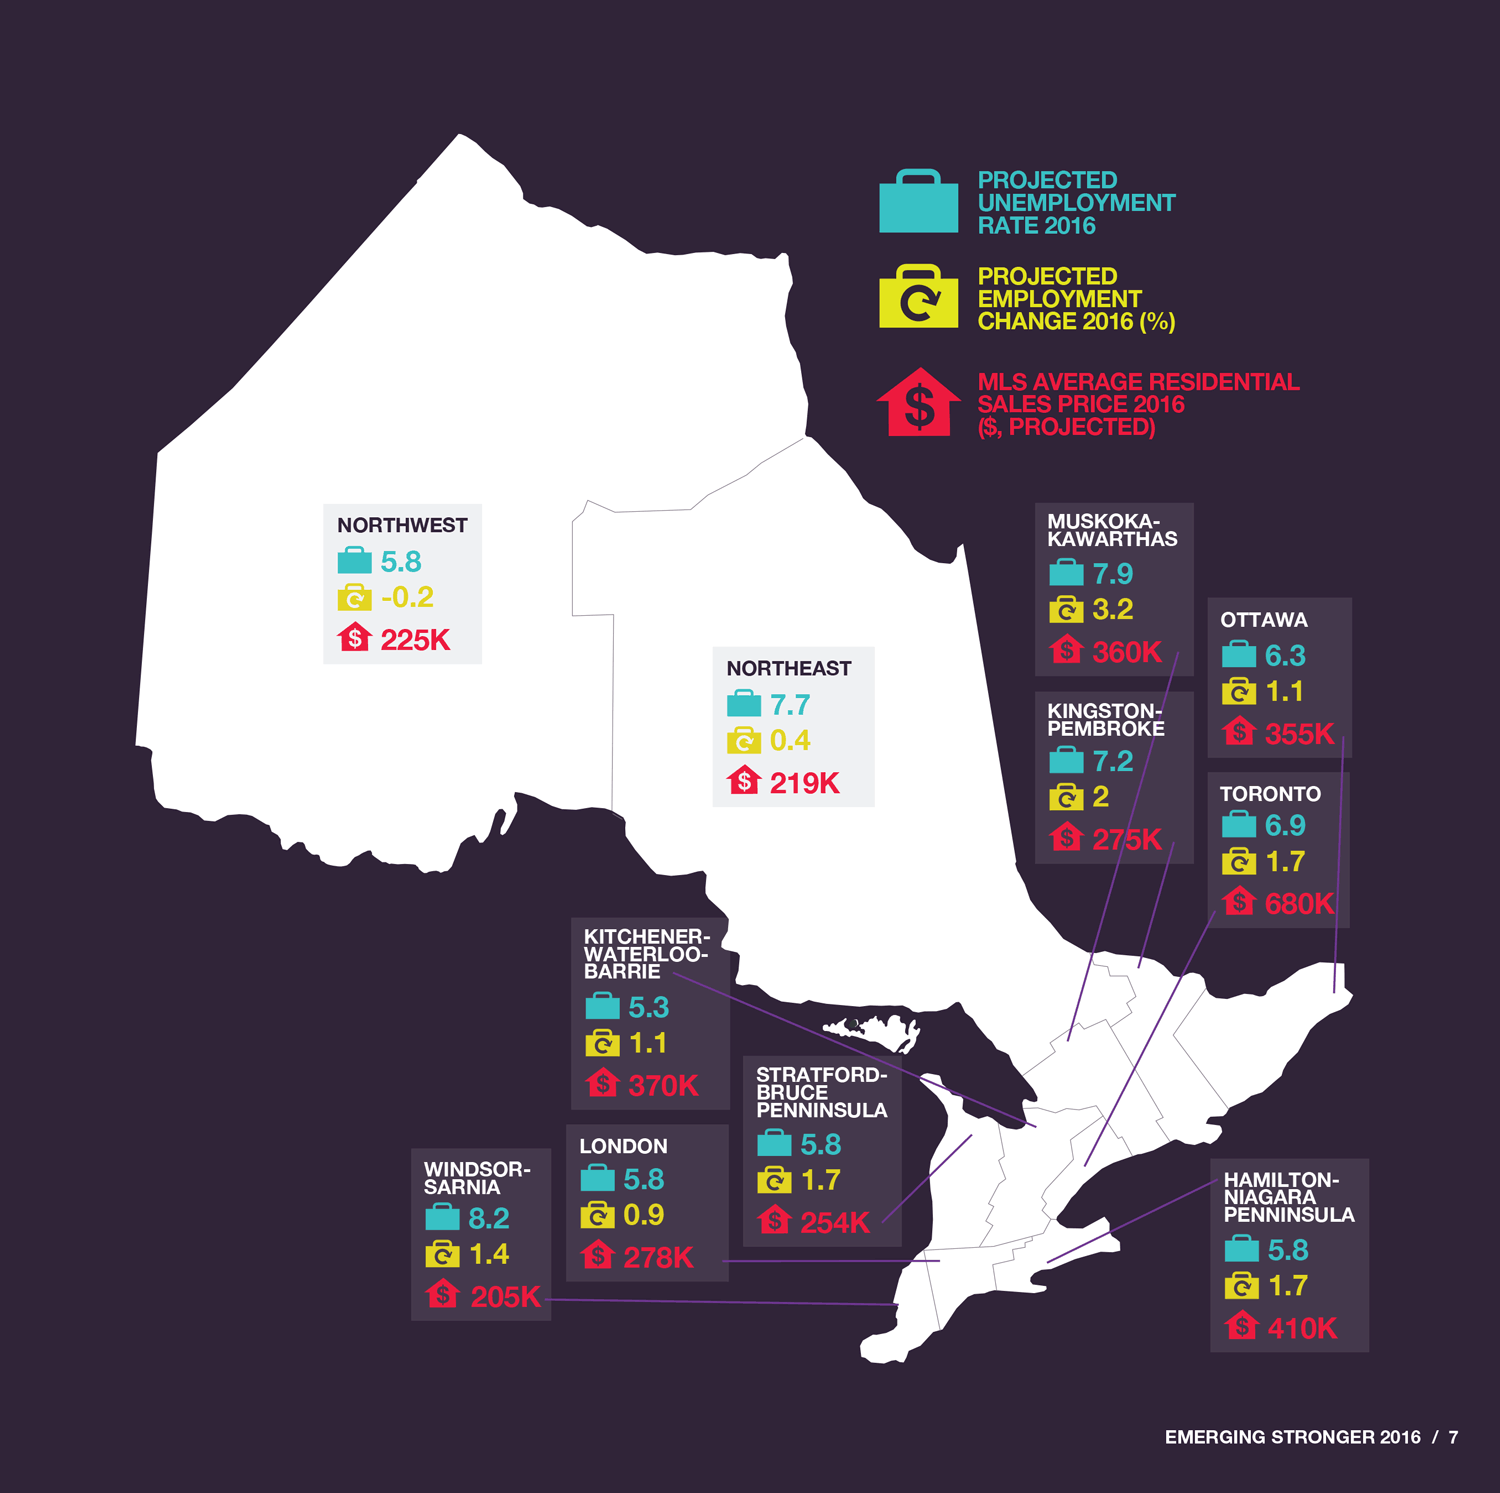
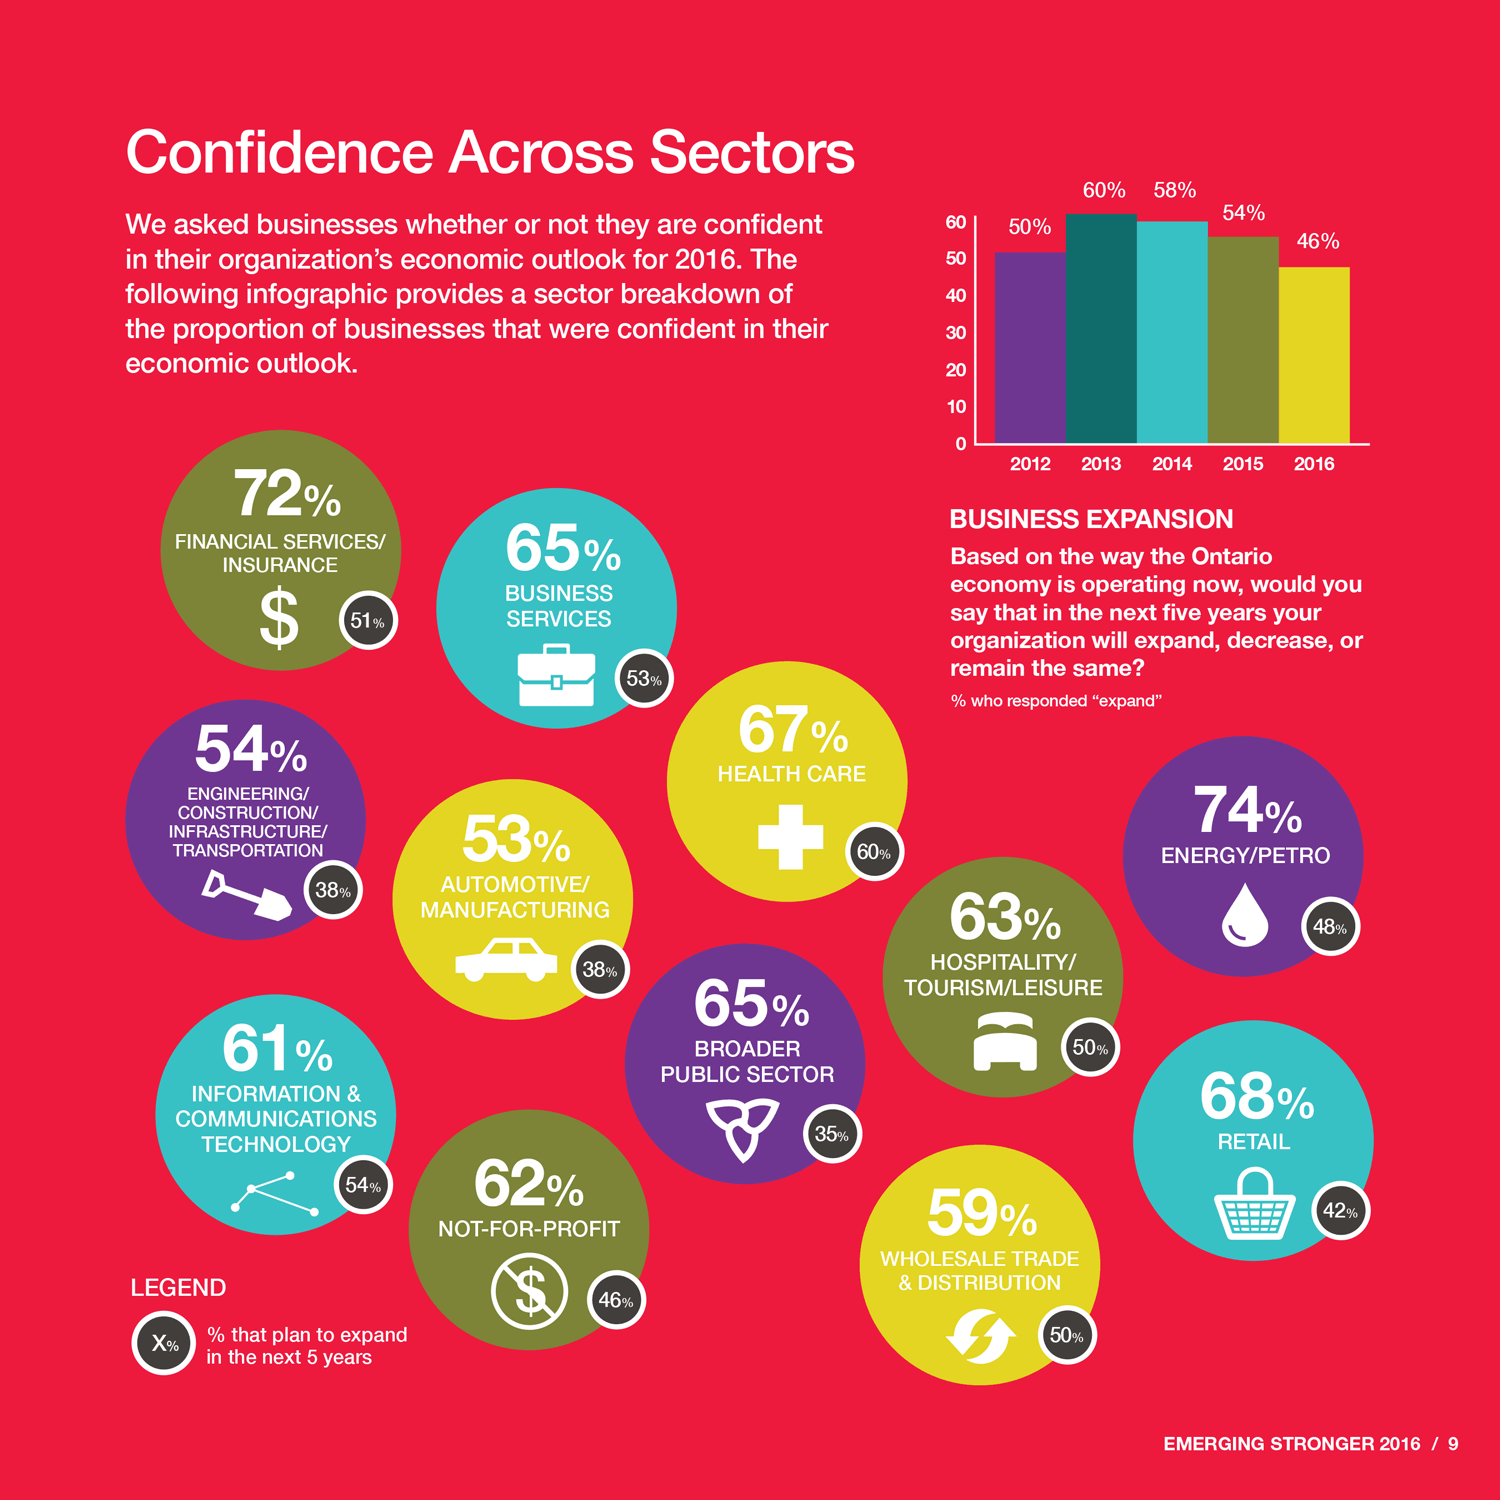
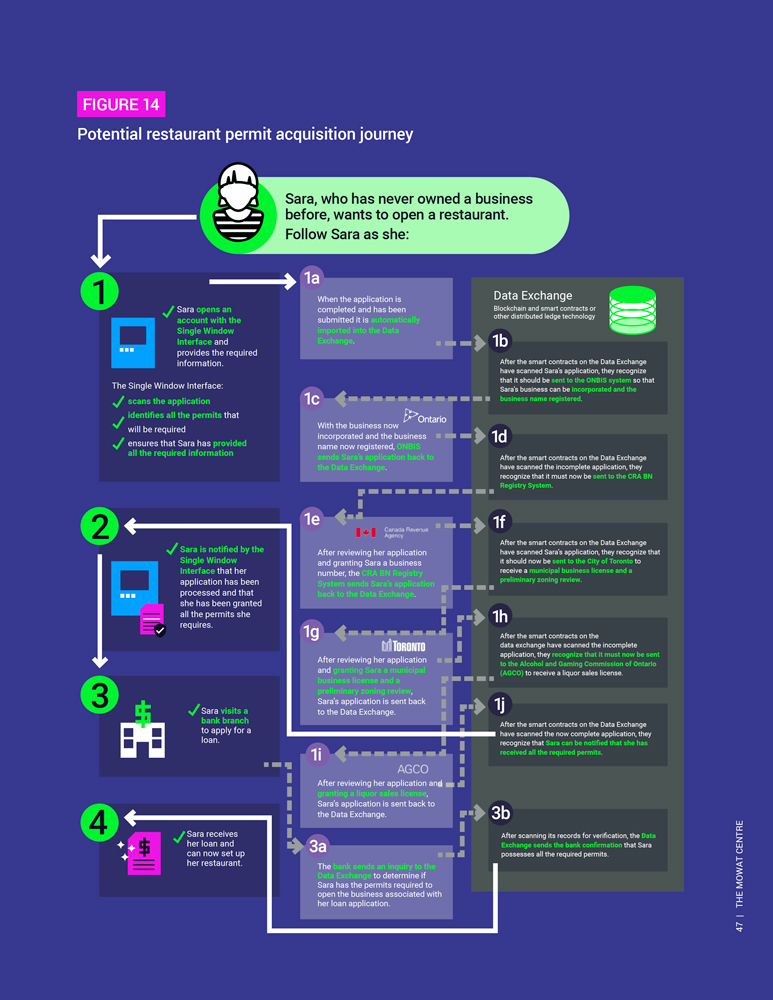
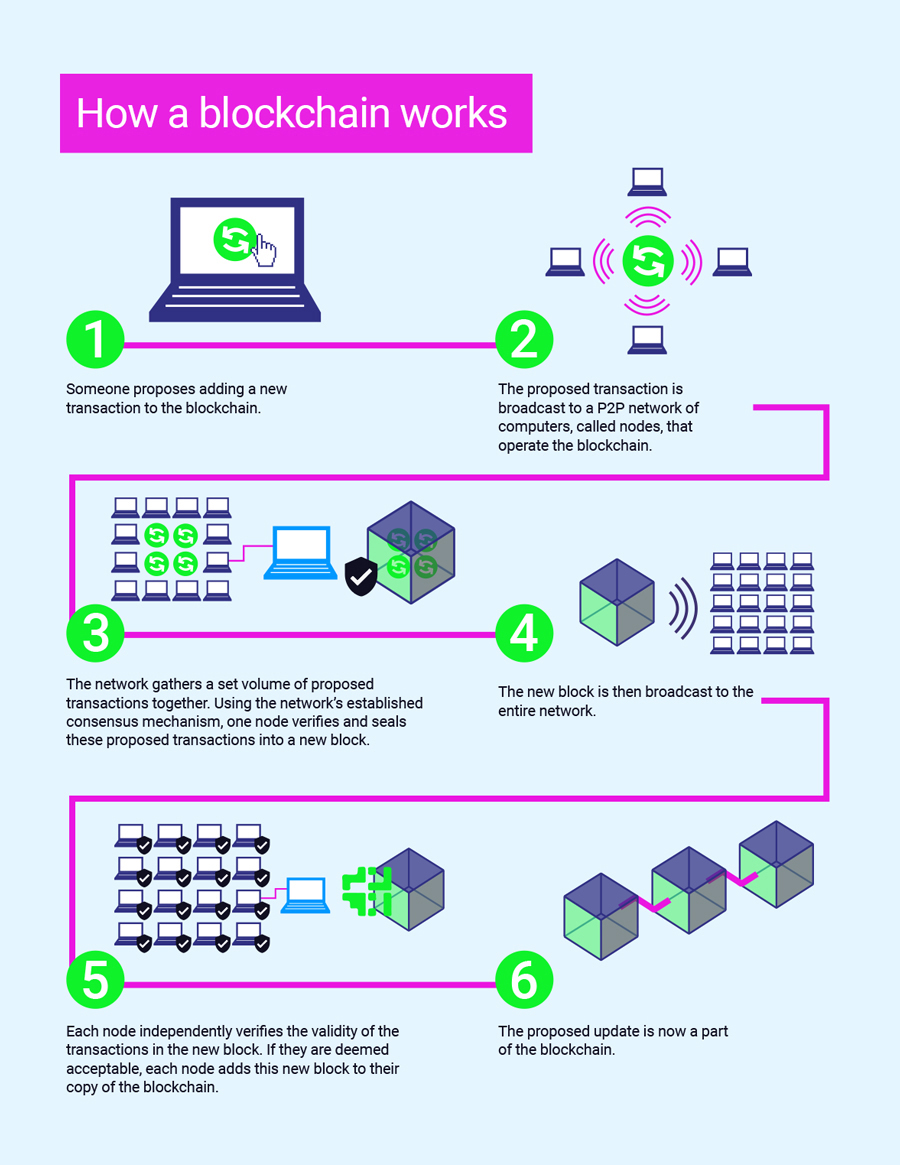
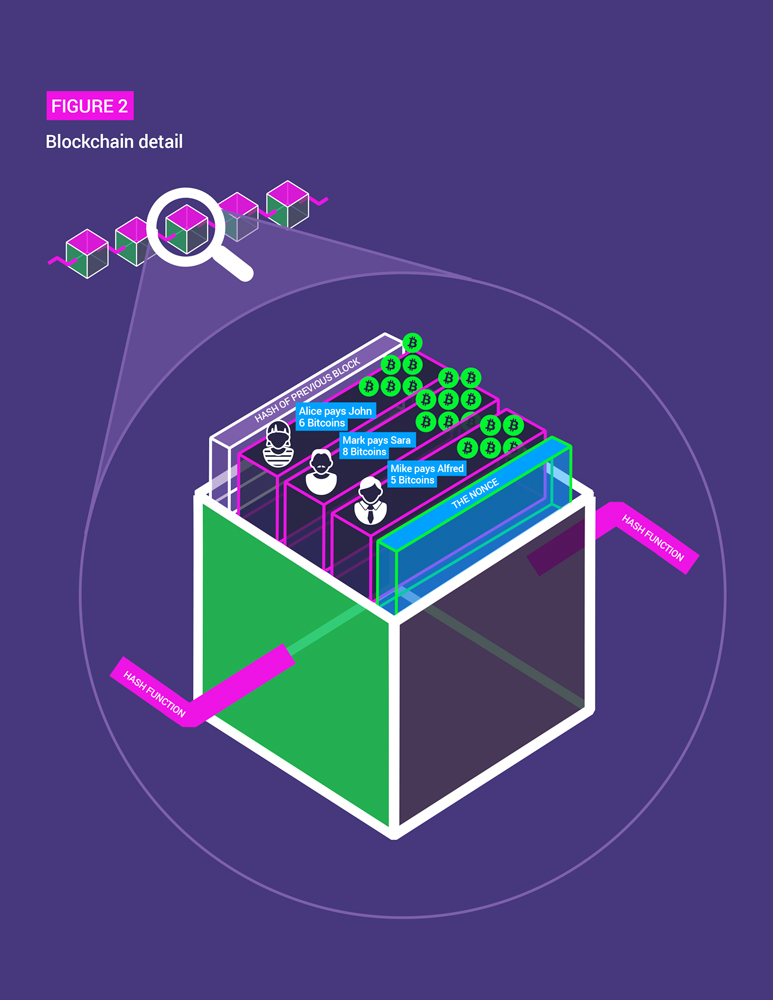
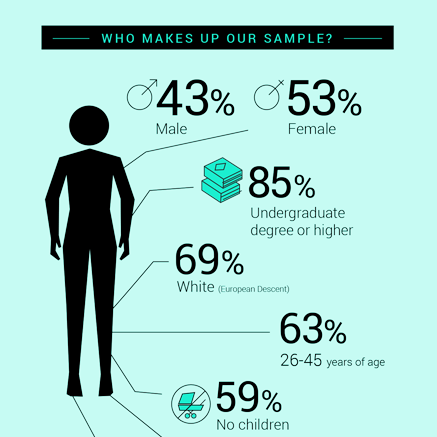
Infographic Design for Research, Data & Public Impact
We design infographics for organizations that need to communicate information clearly and visually. Projects can include:
- Research findings and key statistics
- Program or initiative overviews
- Impact statistics and annual highlights
- One-pagers and issue briefs
- Maps, timelines, and processes
- Data visualizations
- Policy and public information
- Social media graphics based on research or key findings
Whether you’re building a single infographic or a full set, we design for clarity, consistency, and communication.
Our Infographic Design Process
Content Review
You send your data, outline, report, or rough draft. We review the content and identify the key information that needs to come through visually.
Design Strategy
We structure the visual flow, establish hierarchy, and determine the format and visual approach that best suits the content.
Custom Design
We transform your content into a polished, branded infographic using thoughtful typography, visual elements, data visualization, and accessible design principles.
Revisions
You review the first draft and provide feedback. Minor revisions are included, while significant changes to the content or structure may require additional design time.
Final Files
We deliver print-ready and digital-optimized files, with accessible PDF features such as alt text or tagging available when required.